
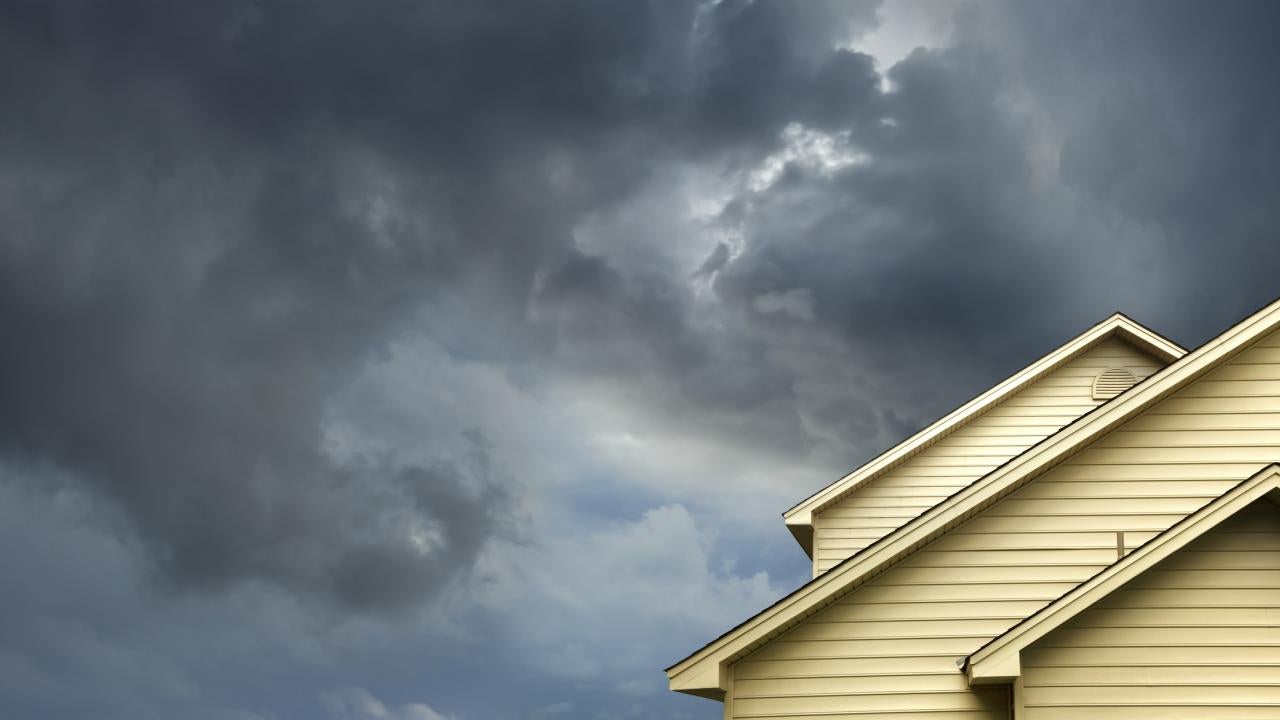
Urban floods. Extreme heat. Hurricane storm surges. Polar vortices. Droughts and wildfires. Many casual conversations these days seem to open with anecdotes about the weather and, unfortunately, the effects of a changing climate on the environment, energy infrastructure, economy, and people.
The consequences of changing Earth systems are global. And they are demonstrably growing. What will the future look like, and how can our society plan to adapt to that future?
There is an urgent need for credible U.S. projections that have finely detailed views across space and time, said Paul Ullrich, a professor of regional climate modeling at the University of California, Davis.
Such information, he added, would give the research community “targeted regional climate impact simulations” that clarify local effects on infrastructure and society.
TGW simulations: Modeling possible futures
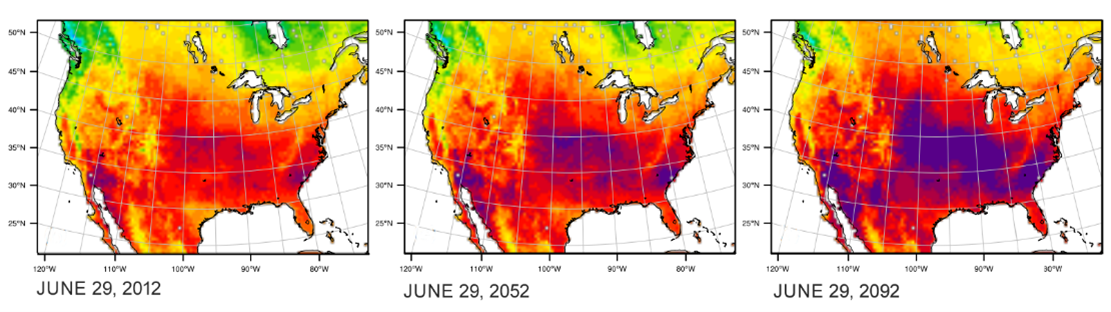
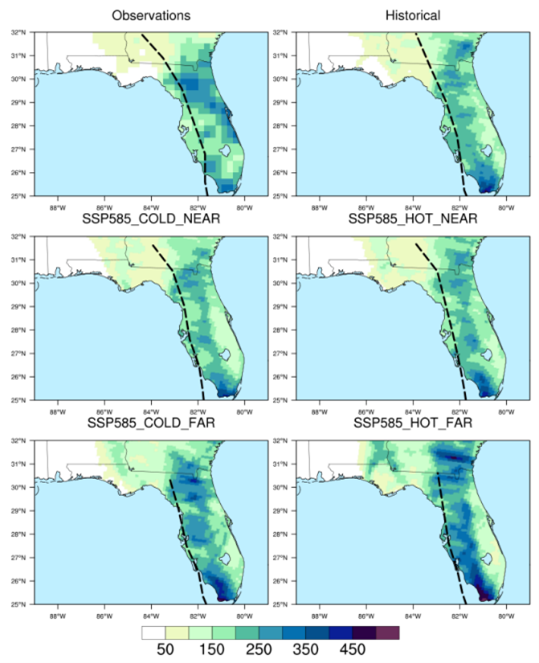
To address these needs, a group of DOE-funded scientists recently released a set of high-resolution scenarios that span a range of plausible changes in U.S. climate over the 21st century. The approach is called thermodynamic global warming (TGW).
These scenarios are the result of a collaborative effort between two U.S. Department of Energy (DOE) projects, Integrated Multisector, Multiscale Modeling (IM3) and A Framework for Improving Analysis and Modeling of Earth System and Intersectoral Dynamics at Regional Scales (HyperFACETS). The two projects are funded by DOE’s Earth & Environmental Systems Modeling program’s MultiSector Dynamics and Regional & Global Model Analysis program areas, respectively. The two teams worked together to create future scenarios, developing four simulations that look 80 years into the future of the United States, from 2020 to 2099.
The scenarios span a wide range of future warming possibilities and are designed to show how the events of the previous 40 years (1980-2019) would “replay” under warmer conditions. Each historic event replays eight times in the simulations — once in each of the two 40-year future periods for each of the four scenarios.
These data sets provide eight future instances of those events that can be used to show how previous challenges to the electricity grid could worsen under more extreme conditions.
Jennie Rice, a senior research scientist at Pacific Northwest National Laboratory and IM3’s Principal Investigator, explains that the TGW simulations indicate potential increases in extreme event intensity, geographic scope, and duration, including how previously non-extreme events could become extreme under a warmer future.
“For example, for each heat wave or cold snap that occurred between 1980-2019, these data sets provide eight future instances of those events that can be used to show how previous challenges to the electricity grid could worsen under more extreme conditions,” she said.
According to Lawrence Berkeley National Laboratory (LBNL) scientist Andrew Jones, events captured in the simulations include every type of extreme experienced over the 40-year historic period — droughts, storms, dry wind events that increase the risk for wildfire, and events in which multiple extremes occur simultaneously.
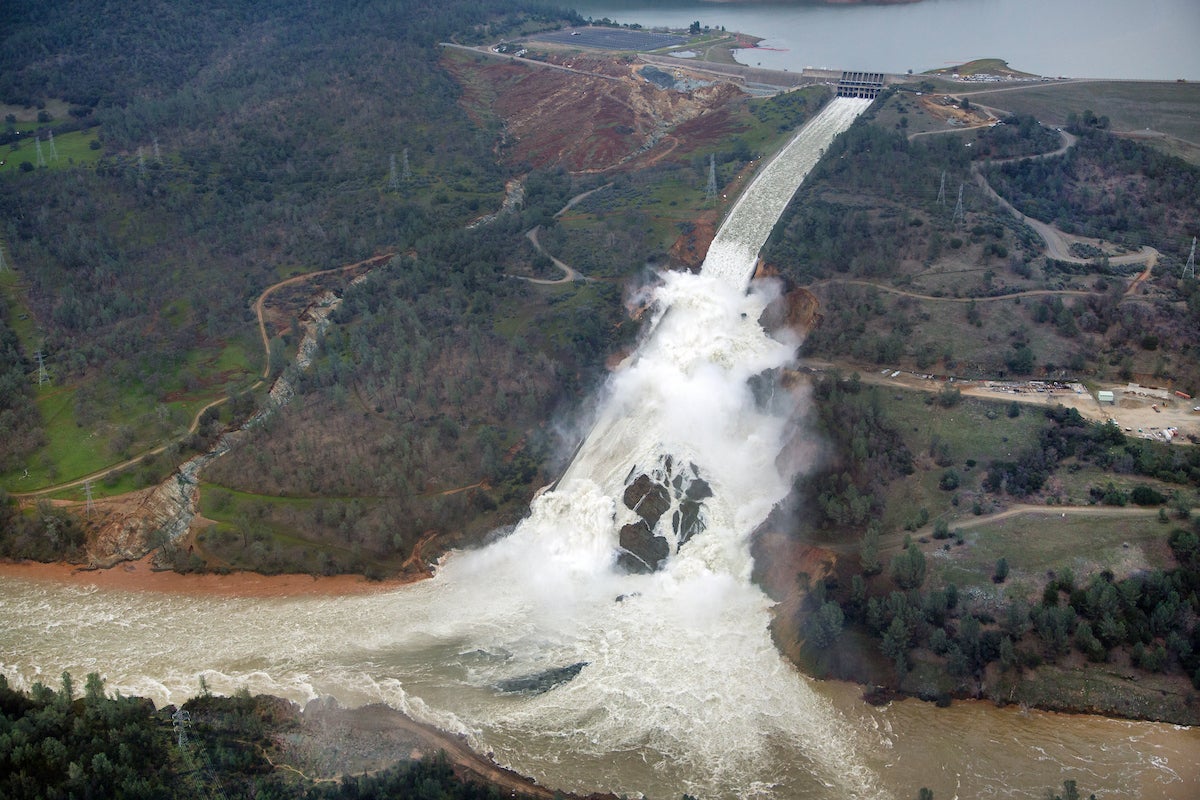
“What is especially unique about this approach is that we reproduce known historic events that led to stress on our infrastructure and society,” Jones said. “For example, these include the deadly Chicago heatwave of 1995 and the back-to-back storms behind the 2017 Oroville dam disaster.”
Jones notes that reproducing known events is useful for validating modeled impacts of these events on society and our adaptive responses.
“This approach also provides a perspective on the future that is grounded in our experience of the past, enabling us to systematically examine how those memorable events might play out under various levels of future warming,” he said. “By applying this technique to such a large historic period and large geographic area, we can also examine how our findings translate to similar events in different contexts. Several past studies have only focused on one event or on a shorter time period.”
The research team cautions that the TGW approach is not intended to estimate future changes in the overall frequency of extreme events linked to changes in large-scale atmospheric dynamics.
A team effort
The simulations were led by LBNL scientists Jones (IM3 and HyperFACETS) and Pouya Vahmani (IM3), and Oak Ridge National Laboratory scientist Deeksha Rastogi (IM3).
They used the Weather Research and Forecasting model to provide physical consistency across 25 hourly and more than 200 three-hourly climate variables with high spatiotemporal (space and time) resolution for the entire 80 years of each simulation. It took over a year to complete the simulations on one of the most powerful high-performance computing systems in the U.S.
The TGW Simulations team currently has a paper in preparation.
Freely available data sets
The TGW simulation data sets are publicly available and more fully described on this landing page that includes instructions for downloading them via Globus, a file-transfer application and download manager. Many computing clusters provide mechanisms for transferring files from Globus endpoints.
Jones encourages the climate modeling community to download the data, apply it to their research, and collaborate with the TGW simulations team. The IM3 and HyperFACETS teams are currently incorporating the simulation results into their research.
“There is so much rich information in this data set,” he said. “Our hope is that the data unlocks a series of extreme event-focused climate impacts and adaptation studies that were previously not possible.”
This data set has not been corrected for bias. A bias-corrected version is under development and will be released on the TGW Simulations website when available.
This article was originally published by the US Department of Energy.
Media Resources
Kat Kerlin, UC Davis News and Media Relations, 530-750-9195, kekerlin@ucdavis.edu