
Quick Summary
- UC-wide program recognizes innovation in information technology
- Map project a self-help tool for youths themselves, to improve their well-being
- Honorable mentions for class scheduling tool and ‘Drones’ app
An interactive website called “Putting Youth on the Map” has landed UC Davis on a different map, as a top winner in the UC system’s annual Larry L. Sautter Award Program for Innovation in Information Technology.
Putting Youth on the Map puts statistical data into map format for use in advocacy efforts aimed at improving the lives of young people in California. The project is led by Nancy Erbstein, assistant research professor in the Department of Human Ecology, and a faculty affiliate with UC Davis’ Center for Regional Change, as principal investigator.
UC Davis also earned two honorable mentions in the 2017 Sautter award program, one for a classroom scheduling tool and the other for Drones, a web application for the management and use of unmanned aircraft systems.
The Sautter award program recognizes faculty and staff for IT innovations that allow the university to be more effective and efficient in its operations, and to better fulfill its mission of teaching, research and public service. Tom Andriola, the UC system’s chief information officer, announced the 2017 award recipients Aug. 8 during the UC Computing Services Conference in San Diego.
The UC Information Technology Leadership Council sponsors the awards program, begun in 2001 and named in memory of Larry L. Sautter, who, at the time of his death in 1999, served as UC Riverside’s associate vice chancellor for Computing and Communications. Selection criteria reflect the council’s commitment to promoting IT innovation and collaboration across the system.
Golden award
Putting Youth on the Map, or PYOM, “is a powerful information resource for youth and adults working to ensure youth well-being in California,” according to the web tool’s “about” page.
“In the big picture, my goal was to equip our young people — especially those least well served by current policies and systems — and their adult supporters, with data they could use in civic engagement efforts to foster change,” Erbstein said.
CASE STUDY
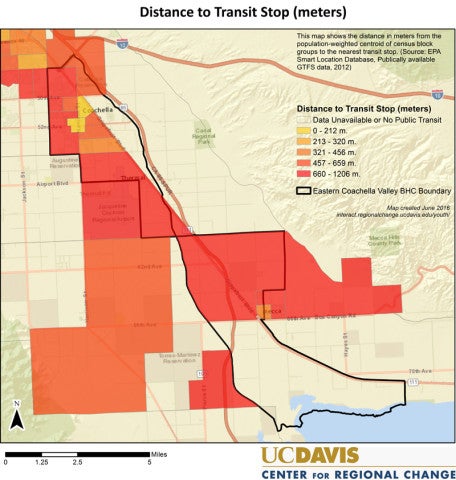
In a post on Zócalo Public Square, Nancy Erbstein and Sergio Cuellar told how young people in the eastern Coachella Valley used Putting Youth on the Map to show the distance between residences and the nearest transit stops — close to a mile for some people. This information, coupled with young people’s own experiences, fed into a Coachella Unincorporated Youth Media report encouraging additional transit stops as well as sidewalks and walking paths to access them.
She said Putting Youth on the Map provides “real access” to publicly available data that can complement primary data collection and other action to promote youth well-being. “By ‘real access’ I mean not only are the data provided in a user-friendly format, but there are tools to help young people understand and use them,” she said.
According to the website, “Youth and adult advocates can use PYOM to identify issues, mobilize action and hold decision-makers accountable for helping improve young people’s opportunities and outcomes … (and) service providers and private foundations can use PYOM to strategically allocate resources.”
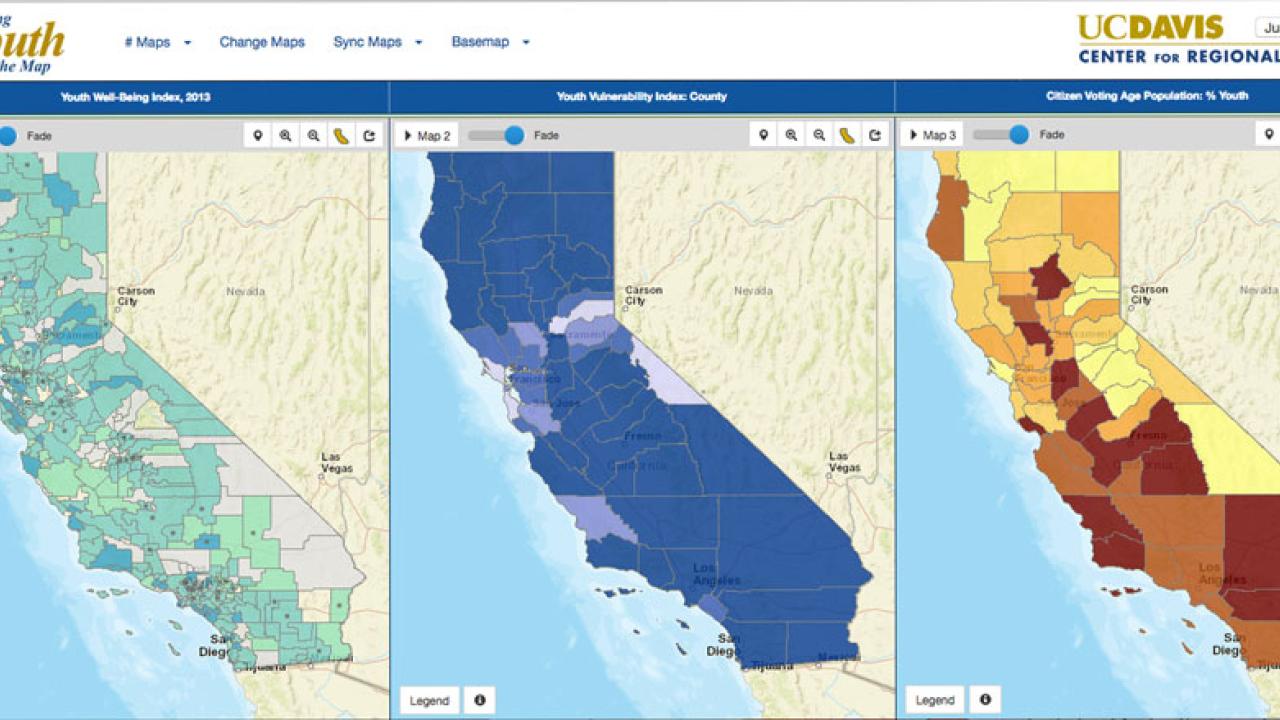
PYOM provides quick visual presentations of California data broken down by city or county or school district or legislative district. The data, from a variety of sources, cover such factors as health, food access, financial resources, truancy and suspensions, age and ethnicity, and access to transportation, and also include scores from the Youth Well-Being Index and the Youth Vulnerability Index, developed by Erbstein and others as part of Putting Youth on the Map.
You choose the statistic you want to display, and the mapping tool turns the data points into different shades of color, so you can easily see, for example:
- High school graduation rates by district, of 0 percent to 29 percent, 30 percent to 39 percent, and so on.
- Numbers and percentages of young people out of work and out of school.
- The percentage of high school graduates completing UC/California State University prerequisite courses.
The mapping tool provides “holistic, place-based indices measuring youth well-being and severe isolation from support,” according to the website.
“Combined with the stories from young people themselves, the PYOM tool can paint a comprehensive picture of youth vulnerability and well-being throughout the state,” states the project’s Sautter award nomination form, submitted by Jonathan London, associate professor, Department of Human Ecology, and faculty director of the Center for Regional Change.
He said nonprofit organizations, government agencies and others “have successfully leveraged the data from this user-friendly tool to guide funders, stakeholders and policymakers to make better decisions for youth.
Erbstein said the Putting Youth on the Map team has included many contributors:
- Estella Geraghty, formerly at UC Davis Medical Center, who served as co-PI during the first year
- Sergio Cuellar, Cassie Hartzog, Gail Lampinen and Sara Watterson, all of the Center for Regional Change
- Sheryl-Ann Simpson, assistant professor, Department of Human Ecology
- Glenda Drew, professor, Department of Design
- Youth development and nutrition-focused staff and academics at UC Agriculture and Natural Resources, and UC CalFresh Nutrition Education Program
- Undergraduate and graduate student interns from the design, public health, sociology, community development and geography programs
“And last, but certainly not least, young equity advocates and their hosts, South Sacramento Building Healthy Communities, Fathers and Families of San Joaquin (Stockton) and Eastern Coachella Valley BHC,” Erbstein said.
Finally, she acknowledged generous support from The California Endowment, UC Agriculture and Natural Resources, the Center for Collaborative Research for an Equitable California and the Sierra Health Foundation.
Honorable mentions
- Instructional Planning and Administration — The IPA class scheduling tool streamlines a complex, labor-intensive process involving faculty, department staff and the registrar. “IPA helps departments and campuses make smarter, data-driven decisions on which courses to offer and when to offer them to meet the needs of our students,” according to the project’s nomination form. Sponsored by the Administrative Application Development Initiative and created through a collaborative effort of staff from academic departments across the campus, with the technical team housed in Jeremy Phillips’ IT group in the Division of Social Sciences. The project’s Sautter award nomination form lists Christopher Thielen as the lead application developer and Lloyd Wheeler as application developer.
- Drones — From UC Davis-based Risk and Safety Solutions, which develops safety and compliance software for use within and outside UC. The unit operates under the associate vice chancellor of Safety Services, UC Davis; and the chief risk officer for the UC Office of the President. See the project’s Sautter award nomination form for the names of everyone who contributed.