The locations of 15 out of 16 California earthquakes, including last week's central California quakes, have now been accurately predicted by a 10-year forecast made in 2001. The earthquake "scorecard" was originally developed by researchers at the University of Colorado who are now at the University of California, Davis, and researchers from NASA's Jet Propulsion Laboratory (JPL), Pasadena, Calif., with funding from NASA and the U.S. Department of Energy.
"We're rather astonished we're right this much of the time," said John Rundle, director of the Computational Science and Engineering initiative at the University of California, Davis, who leads the group that developed the forecast scorecard.
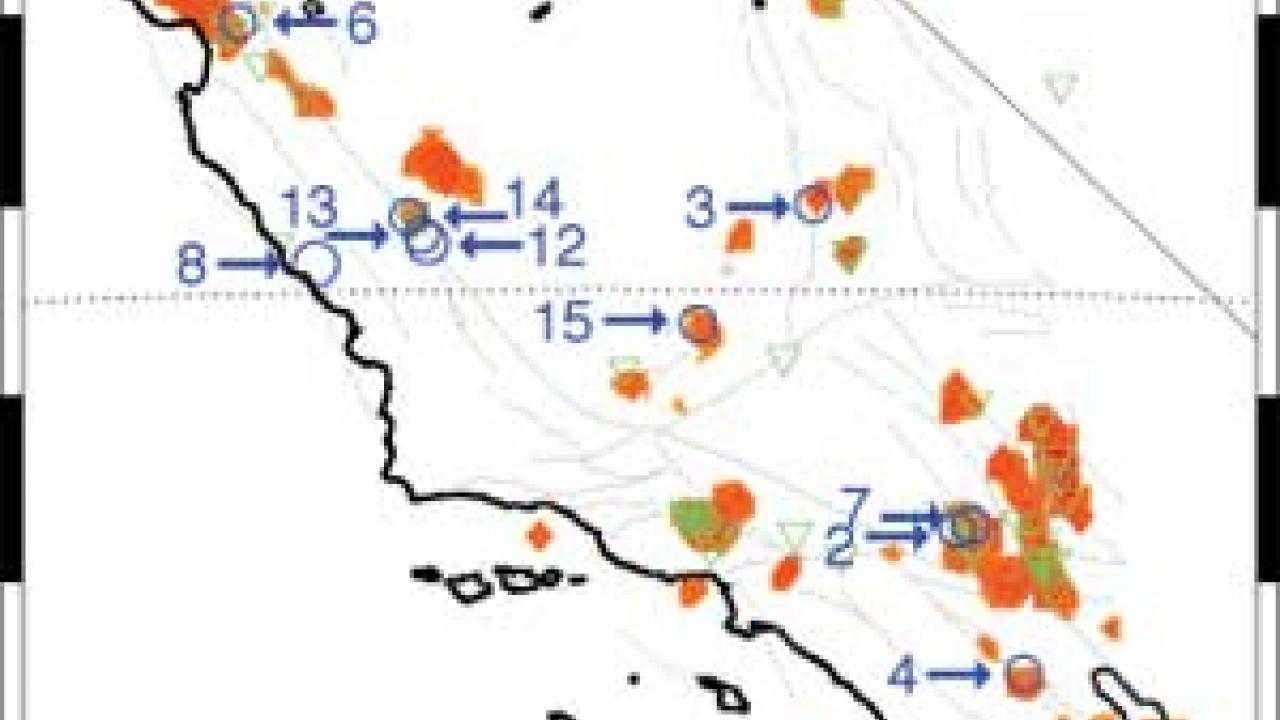
Out of 16 earthquakes of magnitude 5 and higher that have occurred since January 1, 2000, 15 fall on "hotspots" identified by the forecast. Twelve of the 16 quakes occurred after the paper was originally published in the journal Proceedings of the National Academy of Sciences of the U.S.A. in February 2002.
The scorecard uses records of earthquakes from 1932 onwards to predict locations most likely to have quakes of magnitude 5 or greater between 2000 and 2010. Small earthquakes of magnitude 3 and above may indicate that stress is building up along a fault, Rundle said. While activity continues on most faults, some of those faults will show increasing numbers of small quakes, while other faults will appear to shut down. Both effects may herald large events, he said. The forecast does not attempt to predict when an earthquake might occur within the 10-year period.
The scorecard forecast generated a map of California from the San Francisco Bay Area to the Mexican border, divided into approximately 4,000 boxes, or "tiles." For each tile, the researchers calculated the seismic potential and assigned color-coding to show the areas most likely to experience quakes over a 10-year period.
"Essentially, we look at past data and perform math operations on it," said James Holliday, a UC Davis graduate student working on the project. The map includes regions in both southern and central California. Instrumental earthquake records are available for Southern California since 1932, and for Northern California since 1967. The scorecard gives more precision than a simple look at where quakes have occurred in the past, Rundle said.
"In California, the problem is that there is quake activity at some level almost everywhere. With this method, we can narrow the locations of the largest future events to approximately 6 percent or less of the state," Rundle said. "Such information could help engineers and government decision makers prioritize areas for further testing and seismic retrofits."
Rundle and Holliday are working to refine the method and find new ways to visualize the data.
So far, only one earthquake, a magnitude 5.2 quake on June 15 under the ocean near San Clemente Island, was missed by the forecast. Rundle believes this "miss" may be due to larger uncertainties in earthquake records in that undersea region as compared to land areas. San Clemente Island is at the edge of the coverage area for Southern California's seismograph network.
The scorecard is one component of the QuakeSim project, sponsored by NASA's Science Mission Directorate, in partnership with Goddard Space Flight Center and the science/technology communities.
"QuakeSim seeks to develop tools for quake forecasting by integrating high-precision, space-based measurements from global positioning system satellites and interferometric synthetic aperture radar (InSAR) with numerical simulations and pattern recognition techniques," said Andrea Donnellan, QuakeSim principal investigator at JPL.
"It includes historical data, geological information and satellite data to make updated forecasts of quakes, similar to a weather forecast," she said.
Other collaborators on the forecast scorecard include Kristy Tiampo at the University of Western Ontario, Canada; William Klein at Boston University; and Jorge S. Sa Martins, at the Universidad Federal Fluminense in Rio de Janeiro, Brazil.
Media Resources
Andy Fell, Research news (emphasis: biological and physical sciences, and engineering), 530-752-4533, ahfell@ucdavis.edu
John Rundle, NASA Headquarters, (530) 752-6416, jbrundle@ucdavis.edu
Gretchen Cook-Anderson, Jet Propulsion Laboratory, (202) 358-0836
Alan Buis, (818) 354-0474