California drivers lost about $232 million to costs associated with wildlife-vehicle conflicts in 2018 and over $1 billion since 2015, according to the sixth annual Wildlife Vehicle Conflict report from the Road Ecology Center at the University of California, Davis.
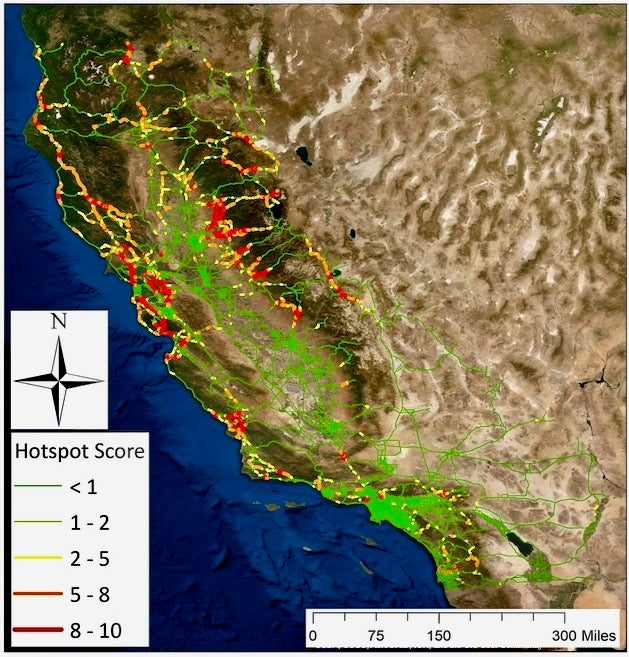
The report identifies the top “hot spots” for wildlife-vehicle conflicts, or WVCs, in the state. This perennially includes highways in the central Sierra Nevada and San Francisco Bay Area. In 2018, these included:
- Highways 280, 24, 101, 580 and 680 in the San Francisco Bay Area
- Highways 5, 101 and 70 in the northern part of the state
- Highways 80, 50 and 49 in the Sacramento-Placerville area
- Highways 5, 15, 405, 101, 78 and 79 in Southern California
View press kit of maps and images.
Data could help prioritize crossings
The authors recommend the state use the report’s data to prioritize road and highway projects that could minimize collisions between vehicles and animals at these known hot spots for wildlife and human safety.
This could help counter what is currently a mismatch between where computer models predict wildlife linkages should be and where this report shows wildlife-vehicle conflicts actually occur.
“Currently, California builds about two wildlife crossings per year to protect drivers and wildlife,” said Fraser Shilling, co-director of the UC Davis Road Ecology Center. “At this rate, it will take over a century to mitigate the WVC hot spots identified in the report.”
Public can help
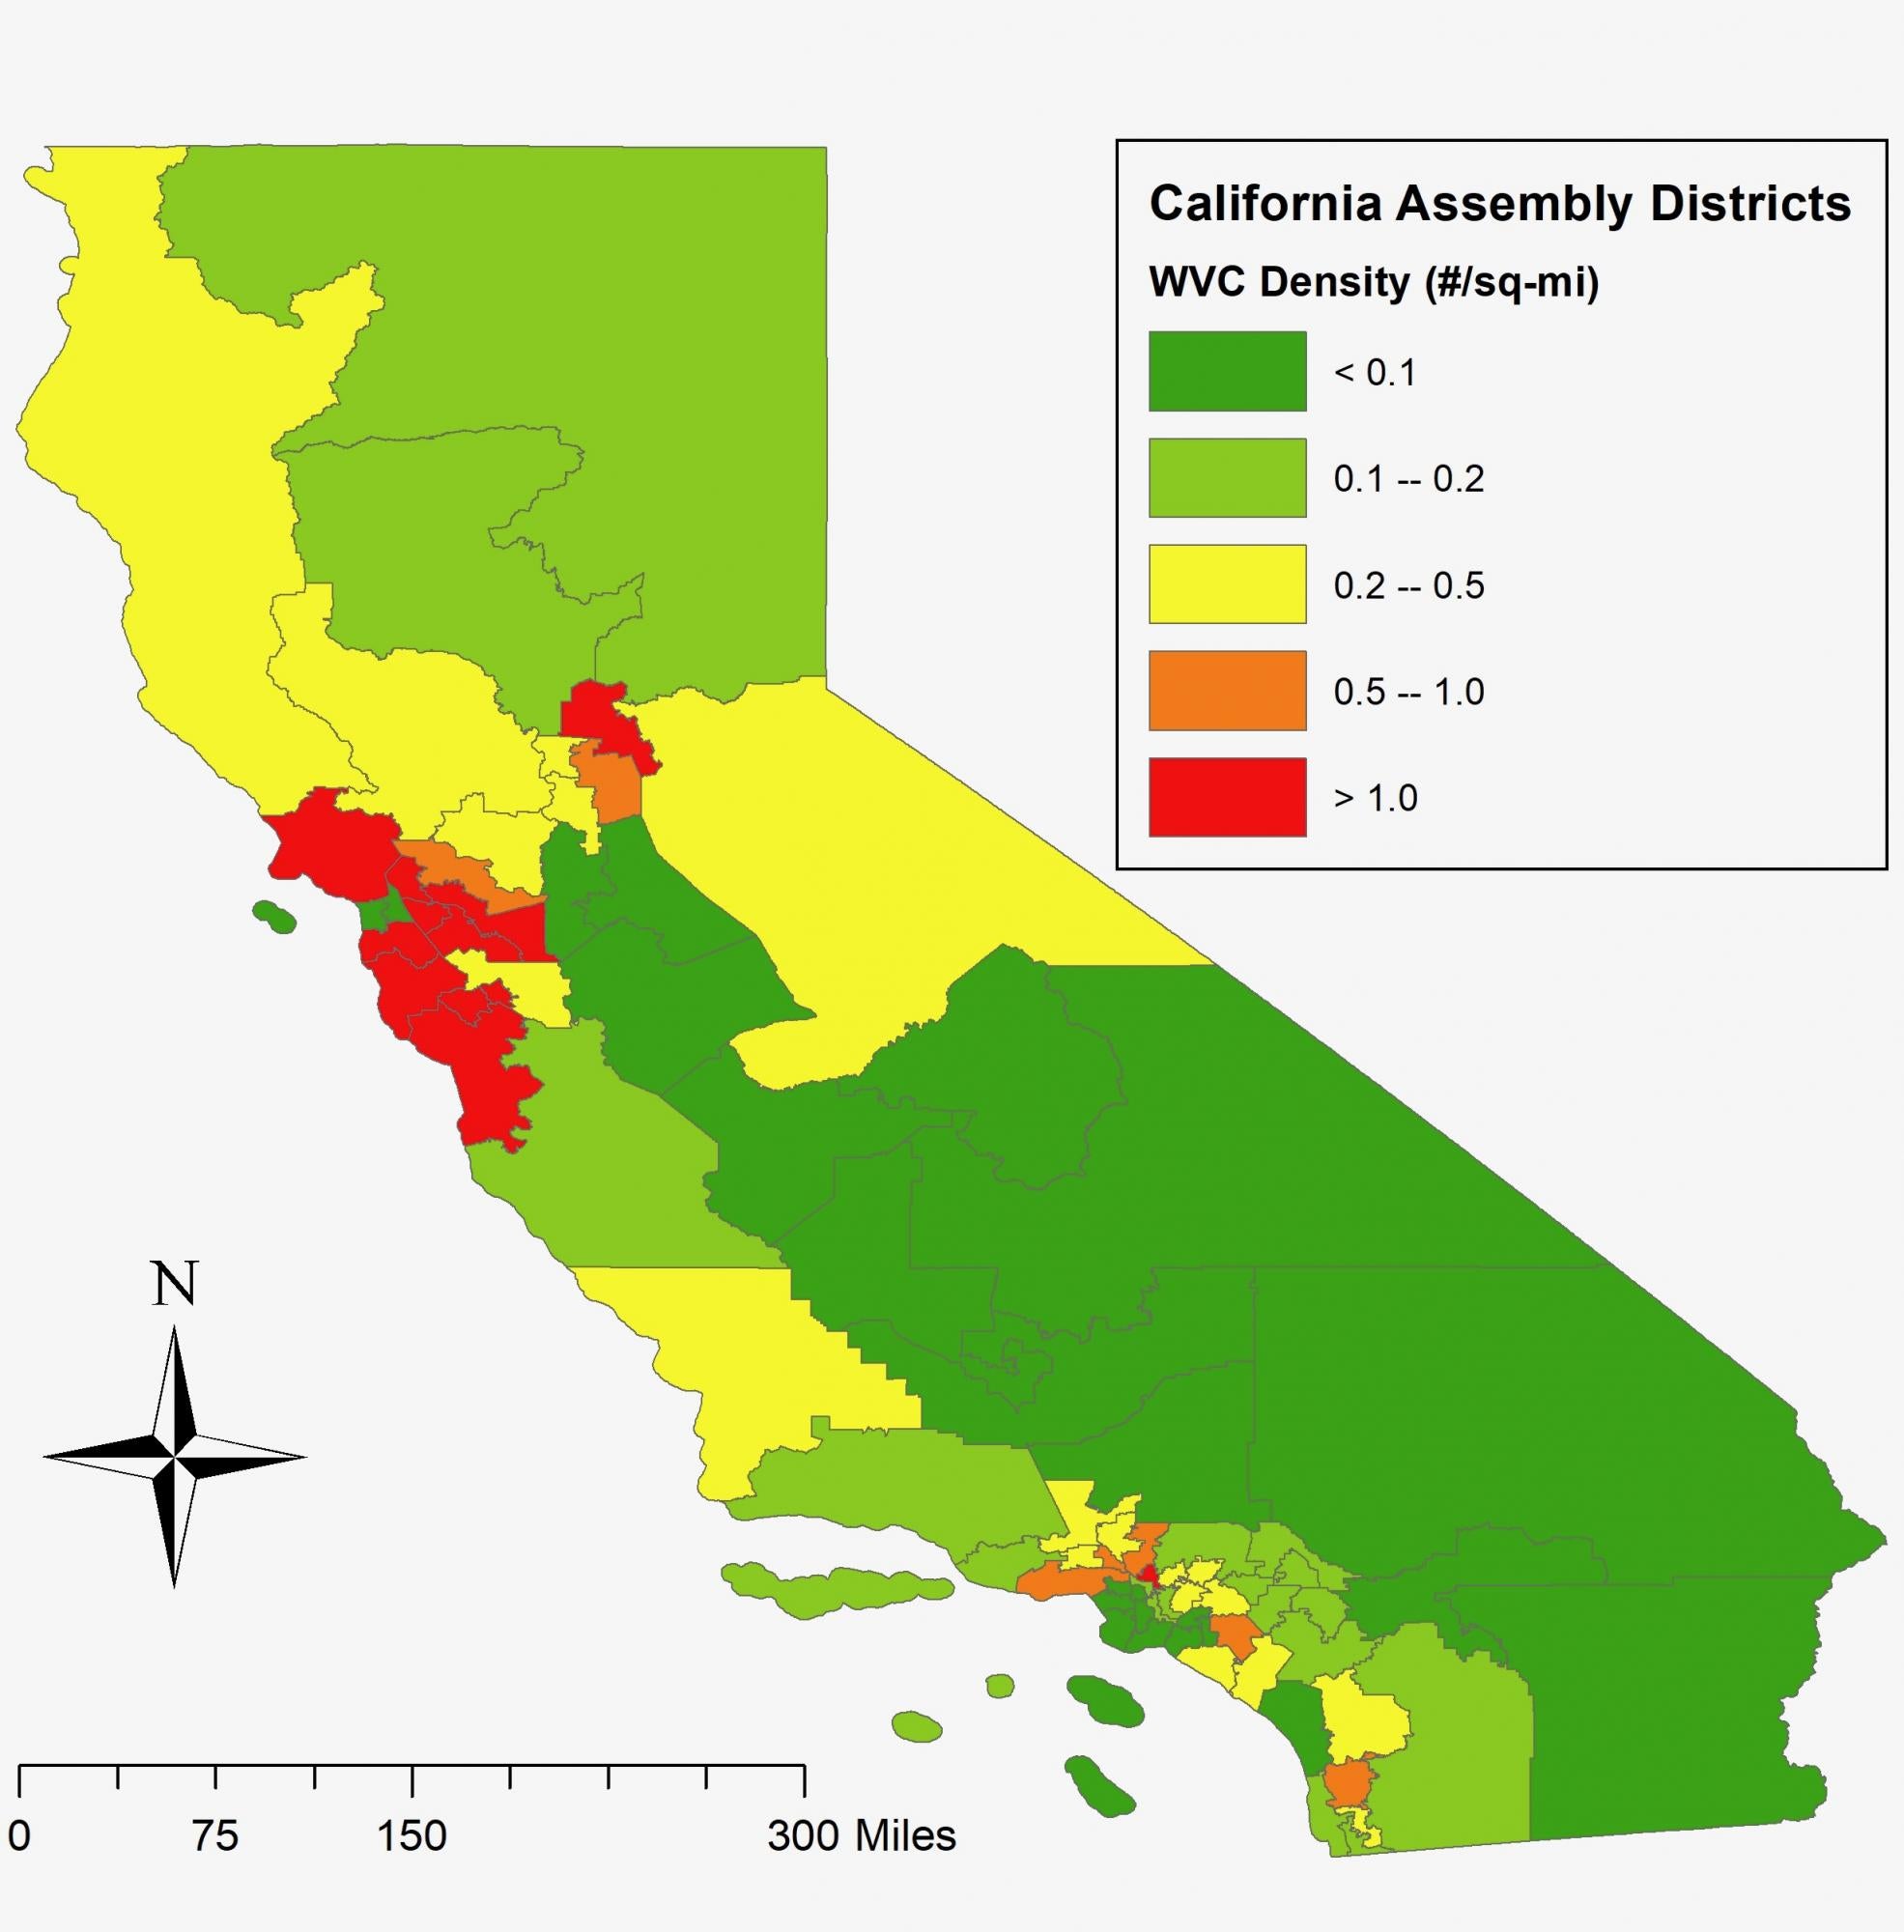
The Road Ecology Center used state data on traffic accidents and roadkill observations to map stretches of 15,160 miles of California highways for the report. It highlighted WVC hot spots based on more than 26,000 traffic incidents involving wildlife that were recorded by the California Highway Patrol and more than 42,000 carcasses reported to the California Roadkill Observation System, or CROS, between 2009 and 2018.
The dataset used in the report is the largest in California but is composed entirely of voluntary reports by the public and state agencies.
The center has also released a new way for the public and government staff to help collect WVC data. CROS has been updated with a new look and “one-click” functionality, allowing anyone to take a picture of a road-killed animal with their phone and upload it to the website-database.
Complementing this new data collection system is a new, real-time display of large-animal WVCs and hot spots in California. Anyone can see where the hot spots are relative to where they live and drive, as well as the most recent wildlife-vehicle conflicts.
The report received no external funding.
Media Resources
Fraser Shilling, UC Davis Road Ecology Center, 530-219-3282, fmshilling@ucdavis.edu
Kat Kerlin, News and Media Relations, 530-750-9195, kekerlin@ucdavis.edu