If you wanted to figure out how much you, individually, contribute to greenhouse gas emissions, you could start by simply gathering your electric and natural gas bills and gasoline receipts and adding up the kilowatt hours and gallons.
Now put yourself in UC Davis' position, with nearly 1,200 buildings, approximately 80 emergency generators, 716 cars and trucks, and 52 buses, and significant off-campus facilities, including the medical center in Sacramento and the Bodega Marine Laboratory.
"We did quite a bit of digging through lots of records and documents," said Aimee Pfohl of the campus's Environmental Health and Safety unit, describing the "tedious" process of calculating the campus's energy use for 2005.
Voluntary reduction effort
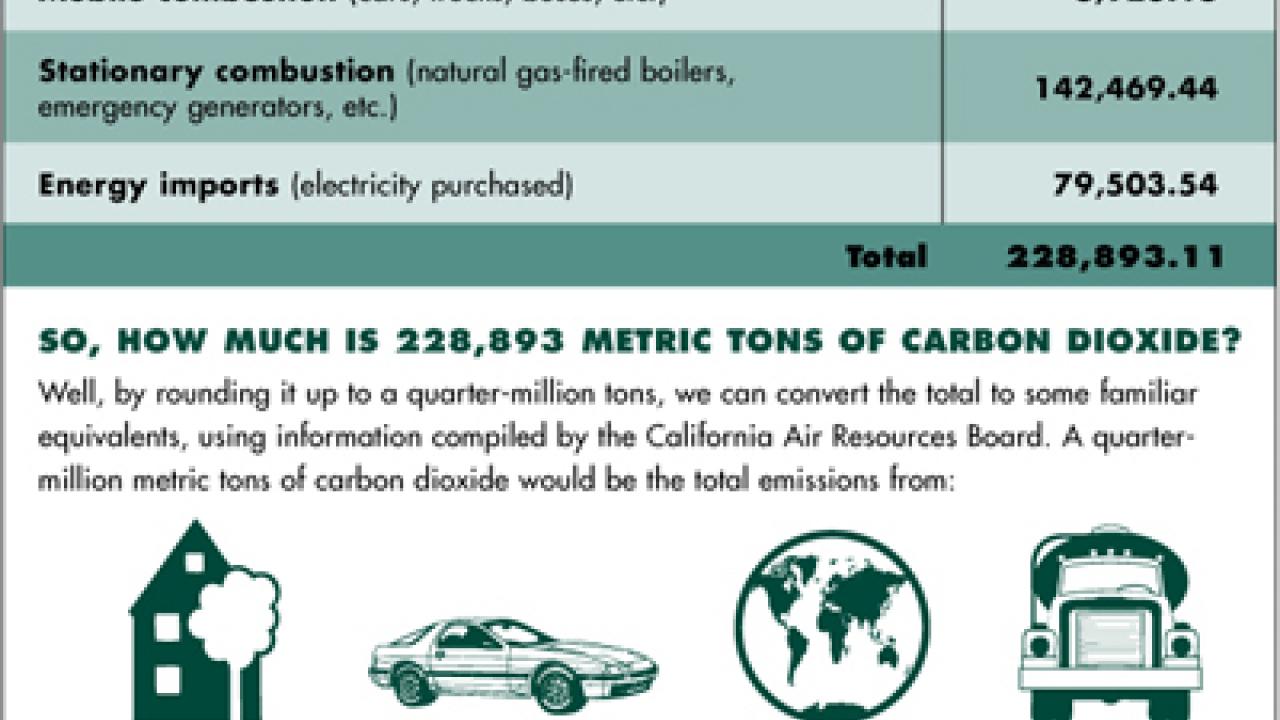
With the data in hand, Pfohl and her team converted the energy consumption to carbon dioxide emissions: 228,893 metric tons from mobile and stationery sources. An independent consultant is in the process of certifying the data for inclusion in the California Climate Action Registry, a voluntary effort of private enterprise and the public sector.
The registry provides a baseline for greenhouse gas reduction efforts to help the environment.
Kristine Haunschild, a fifth-year student who compiled the UC Davis data, said people may look at the total of nearly a quarter-million metric tons of carbon dioxide and ask, "What are they doing at Davis? Are they just this big, smoking pollution source?"
"That's not the case," said Haunschild, a civil engineering major with an environmental emphasis.
She and Pfohl, an environmental protection specialist, pointed out how emissions from UC Davis' main campus are less than those from UC Santa Barbara's main campus, on a per acre basis. UC Santa Barbara and UC San Diego were the first two UC campuses to put their carbon dioxide data on the registry; UC Davis will be the third.
Davis' main campus, at 5,300 acres by far the largest in the UC system, produced much more carbon dioxide than Santa Barbara's main campus, 157,546 vs. 52,201 metric tons. But on a per-acre basis, Davis' emissions worked out to just under 30 metric tons per acre, compared with nearly 53 metric tons for each of the 989 acres that comprise Santa Barbara's main campus.
Assembly Bill 32, signed into law last year, mandates a cutback in such emissions, and the state Air Resources Board is now figuring out how to regulate the process. The resulting policies may exempt public agencies, but the UC system is making it clear that it intends to join in.
Stan Nosek, vice chancellor of the Office of Administration, said UC Davis should be proud of its work to tally greenhouse gas emissions.
"From this starting point, we can set about reducing our emissions, and that will mean a cleaner environment with less global warming," he said. "And, because a cutback will mostly be achieved by cutting back energy use, we will be saving on our energy costs."
Looking ahead, Victoria Evans, assistant director of the UC Davis Air Quality Research Center and a participant in the campus greenhouse gas emissions project, said the challenge for UC Davis "will be reducing greenhouse gas emissions at a time when the campus is still growing significantly."
Haunschild began compiling UC Davis' carbon dioxide emissions last July, gathering records, making phone calls and sending e-mails — seeking data for "anything with a fuel source … every possible source that could be emitting carbon dioxide," even groundskeepers' carts.
With centralized electric billing for the majority of campus buildings, Operations and Maintenance tallied most of UC Davis' kilowatt consumption. The Grounds and Buildings division and Agricultural Services also contributed in a big way, Pfohl said.
All around campus, she added, "Once people knew what we were doing, they were really supportive."
The music department presented an odd situation: receiving its own electric bills. For cases like this, departments tallied their electric use for Haunschild, or forwarded the bills and she did the counting.
Haunschild cross-referenced her data with records kept by UC Davis' electric suppliers, including Pacific Gas and Electric Co., the Sacramento Municipal Utility District and the Western Area Power Administration.
To convert energy use to carbon dioxide emissions, Haunschild used equations supplied by the California Climate Action Registry. For example, the emissions factors for electric suppliers are based on their mix of generating sources, including oil, coal, natural gas, hydroelectric, wind and solar.
As she gathered data, Haunschild set up a recordkeeping system that UC Davis can use in subsequent years to update its greenhouse gas emissions data. In fact, she is now starting on the 2006 data collection.
Pfohl and Evans praised Haunschild's numbers-crunching. "Because UC Davis is so big, conducting our inventory demanded an organizing tool that Kristine developed, otherwise it would have been a stack of spreadsheets," Evans said.
Researchers, including students, are already showing an interest in helping UC Davis cut its emissions. "We've got our numbers, a starting point," Haunschild said, "and now people are approaching us about mitigation."
She recently gave a presentation to the campus's Sustainability Advisory Committee, and she is preparing a paper to present at the Air and Waste Management Association's annual conference, later this year in Pittsburgh.
"UC Davis is like a small city, and my paper describes how we did this," she said.
Media Resources
Clifton B. Parker, Dateline, (530) 752-1932, cparker@ucdavis.edu